> For clean Markdown of any page, append .md to the page URL.
> For a complete documentation index, see https://akamai.ferndocs.com/edge-workers/code-profiler-tutorial/llms.txt.
> For AI client integration (Claude Code, Cursor, etc.), connect to the MCP server at https://akamai.ferndocs.com/_mcp/server.
# Code profiler tutorial
Running EdgeWorkers on Akamai’s edge network presents a lot of opportunities but also comes with some performance considerations. What if the time it takes to execute an EdgeWorkers function negatively impacts request performance? How can I gain insight into the consumption metrics of an EdgeWorkers function and then use this information to improve my code?
In response to these questions we created an EdgeWorkers Code Profiler. A code profiler is a common tool developers use to evaluate and improve code execution time.
# Set up and run the profiler
First let’s take a look at how to set up and run the EdgeWorkers Code Profiler.
1. To use the EdgeWorkers Code Profiler you can install the [Akamai EdgeWorkers Toolkit](https://marketplace.visualstudio.com/items?itemName=akamaiEdgeworker.akamai-edgeworkers-vscode-extension), an extension for Visual Studio Code.
> 📘 In this example we'll use the VS Code extension to profile our code. The EdgeWorker Code Profiler also supports the [IntelliJ Plugin](https://github.com/akamai/edgeworkers-intellij).
>
> You can find more details about the IntelliJ Plugin and how to use it to run the profiler in the [EdgeWorkers Code Profiler](/edge-workers/edgeworkers-code-profiler) section.
As part of setting up this extension, you also need to install the [Akamai CLI](https://github.com/akamai/cli) and create an .edgerc file with [Akamai API Client credentials](https://techdocs.akamai.com/developer/docs/set-up-authentication-credentials).
> 👍 You can also use the CLI to profile your code. You can find more details about the CLI and how to run the profiler in the [EdgeWorkers Code Profiler](/edge-workers/edgeworkers-code-profiler) section.
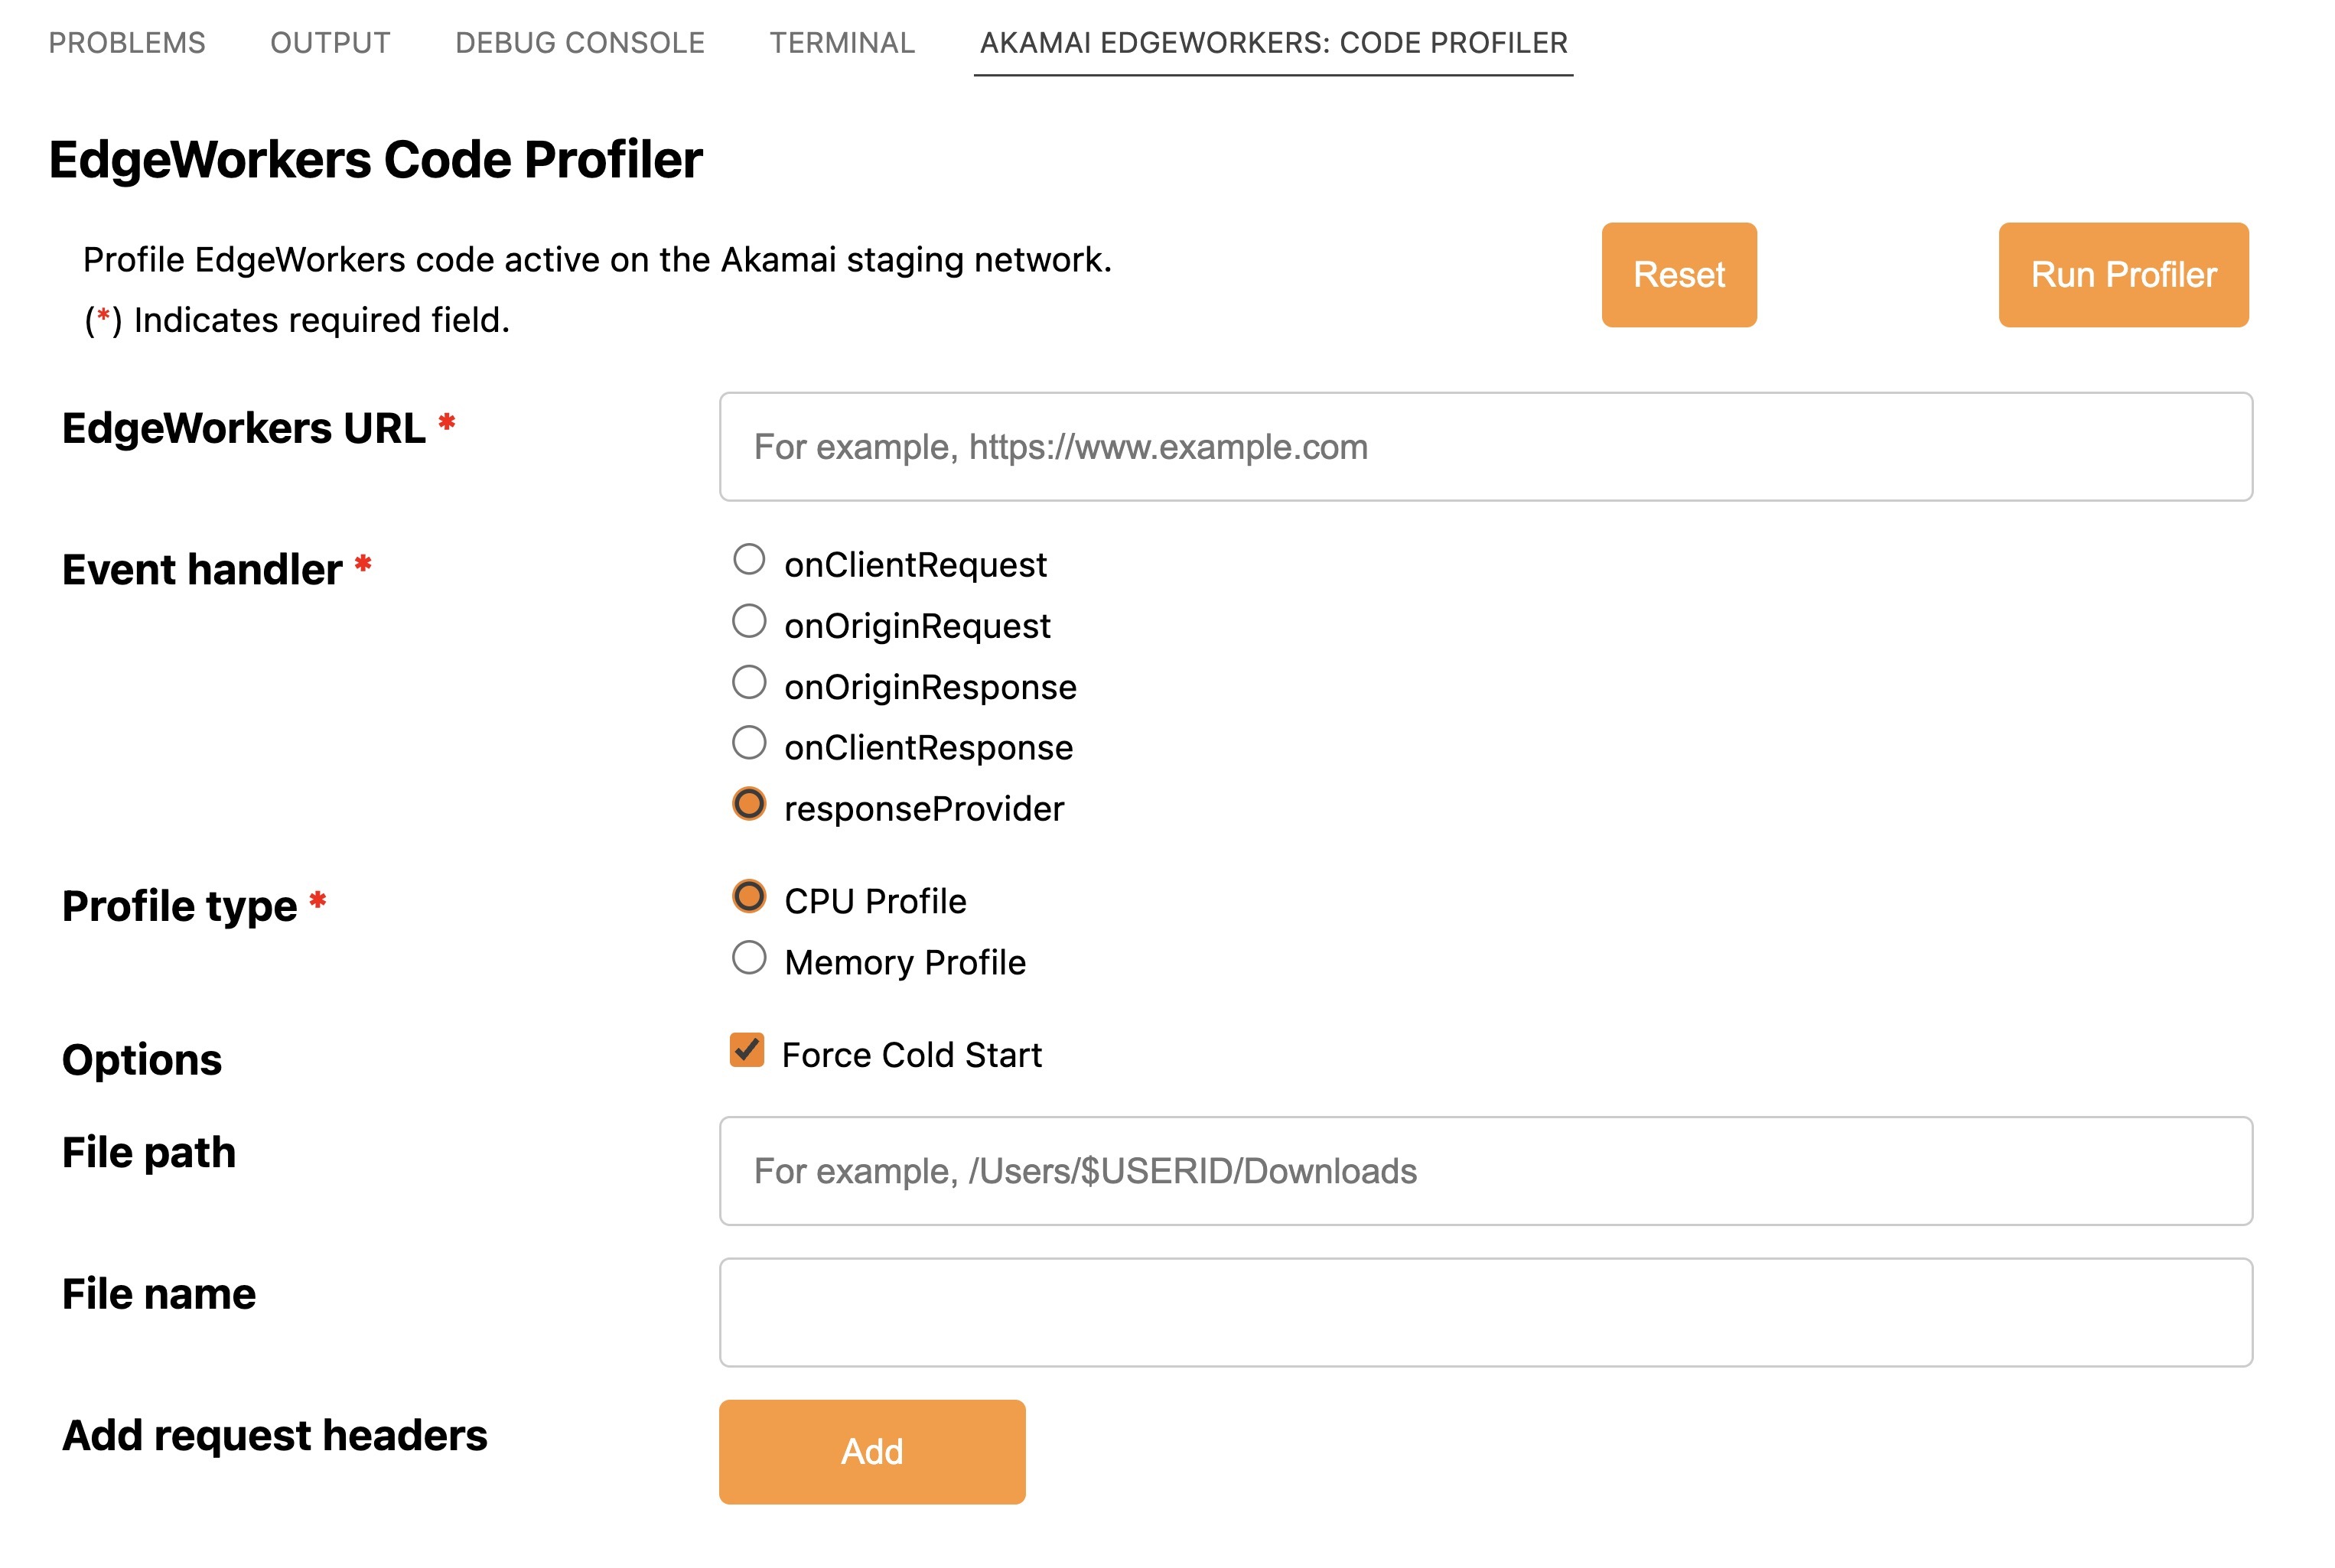
2. Once installed, you can access the profiler in the bottom panel of the EdgeWorkers VScode extension.
3. To profile your code, enter the URL that the EdgeWorkers function is configured to operate at and an event handler to profile. You can optionally add a file path, a file name, and request headers. Then just hit **Run Profiler**.
# Improve your code
In this tutorial we'll profile the [trace-headers](https://github.com/akamai/edgeworkers-examples/tree/master/edgecompute/examples/traffic-filtering/trace-headers) code sample from our [EdgeWorkers GitHub repo](https://github.com/akamai/edgeworkers-examples) and look for opportunities for improvement.
1. Upload the code bundle from [June 23, 2022](https://github.com/akamai/edgeworkers-examples/tree/81b160975e8a38369f91ea9e18ea6ed6429bfef5/edgecompute/examples/traffic-filtering/trace-headers) to a test website.
The EdgeWorkers code is functioning as expected by tracing out request and response headers to the page html.
2. Run the same URL through the EdgeWorkers Code Profiler.
The results show that a lot of time is spent repeatedly calling into the [getHeaders()](request-object.md#getheaders) function. While each call is quick, the repeated calls have a disproportionate impact on the page load time.
3. Let’s take a look at the EdgeWorkers code, under `constructResponseBody()`.
The function iterates through the set of header names and then calls to get all headers again for each key to get the header value. This seems to be an inefficient way to iterate through all headers, and the impact would be much worse with a larger set of headers.
```javascript
/*
Construct entire response body to include request and response headers
*/
function constructResponseBody(request, response) {
let responseBody = "
Request Headers:
";
// Get Request headers and append to response body
Object.keys(request.getHeaders()).forEach((key) => {
request.getHeaders()[key].forEach((headerval) => {
responseBody += key + ": " + headerval + " ";
});
});
responseBody += "
Response Headers:
";
// Get Response headers and append to response body
Object.keys(response.getHeaders()).forEach((key) => {
response.getHeaders()[key].forEach((headerval) => {
responseBody += key + ": " + headerval + " ";
});
});
responseBody += "";
return responseBody;
}
```
4. Now, let’s try to improve the function by iterating through the set of headers together as `key`, `values`.
```javascript
/*
Construct entire response body to include request and response headers
*/
function constructResponseBody(request, response) {
let responseBody = "
Request Headers:
";
// Get Request headers and append to response body
for (const [key, values] of Object.entries(request.getHeaders())) {
values.forEach((headerval) => {
responseBody += key + ": " + headerval + " ";
});
}
responseBody += "
Response Headers:
";
// Get Response headers and append to response body
for (const [key, values] of Object.entries(response.getHeaders())) {
values.forEach((headerval) => {
responseBody += key + ": " + headerval + " ";
});
}
responseBody += "";
return responseBody;
}
```
5. Activate the updated EdgeWorkers version on the Akamai staging network and confirm that you get the same result in a browser.
6. Run the EdgeWorkers Code Profiler again to see the impact on performance.
The result is a big improvement. For this example the “big improvement” is a ~2ms advantage. Hopefully you can use the same technique to improve more complicated EdgeWorkers and keep your websites fast.
# Next Steps
The EdgeWorkers Code Profiler currently provides information about CPU execution time and memory usage. In the coming months we’ll add support for other features to enhance the ability to discover code improvements.
# Resources
- [Akamai EdgeWorkers Toolkit for VSCode](https://marketplace.visualstudio.com/items?itemName=akamaiEdgeworker.akamai-edgeworkers-vscode-extension)
- [VSCode Extension repo](https://github.com/akamai/edgeworkers-vscode)
- [IntelliJ Plugin](https://github.com/akamai/edgeworkers-intellij)
- [EdgeWorkers Code Profiler](/edge-workers/edgeworkers-code-profiler) in Akamai TechDocs
 # Improve your code
In this tutorial we'll profile the [trace-headers](https://github.com/akamai/edgeworkers-examples/tree/master/edgecompute/examples/traffic-filtering/trace-headers) code sample from our [EdgeWorkers GitHub repo](https://github.com/akamai/edgeworkers-examples) and look for opportunities for improvement.
1. Upload the code bundle from [June 23, 2022](https://github.com/akamai/edgeworkers-examples/tree/81b160975e8a38369f91ea9e18ea6ed6429bfef5/edgecompute/examples/traffic-filtering/trace-headers) to a test website.
The EdgeWorkers code is functioning as expected by tracing out request and response headers to the page html.
# Improve your code
In this tutorial we'll profile the [trace-headers](https://github.com/akamai/edgeworkers-examples/tree/master/edgecompute/examples/traffic-filtering/trace-headers) code sample from our [EdgeWorkers GitHub repo](https://github.com/akamai/edgeworkers-examples) and look for opportunities for improvement.
1. Upload the code bundle from [June 23, 2022](https://github.com/akamai/edgeworkers-examples/tree/81b160975e8a38369f91ea9e18ea6ed6429bfef5/edgecompute/examples/traffic-filtering/trace-headers) to a test website.
The EdgeWorkers code is functioning as expected by tracing out request and response headers to the page html.
 2. Run the same URL through the EdgeWorkers Code Profiler.
The results show that a lot of time is spent repeatedly calling into the [getHeaders()](request-object.md#getheaders) function. While each call is quick, the repeated calls have a disproportionate impact on the page load time.
2. Run the same URL through the EdgeWorkers Code Profiler.
The results show that a lot of time is spent repeatedly calling into the [getHeaders()](request-object.md#getheaders) function. While each call is quick, the repeated calls have a disproportionate impact on the page load time.