

mPulse reports
mPulse is Akamai‘s real user measurement solution that provides near real-time feedback about how your site is performing. mPulse reports for EdgeWorkers include data about EdgeWorkers errors generated due to JavaScript errors. You can view the error reports in the mPulse dashboard.
📘 To use this feature you need to be part of an mPulse paid plan. For more information about setting up and using mPulse refer to the mPulse guide.
Enable mPulse error reports for EdgeWorkers
-
Before you begin, make sure that your property includes the mPulse behavior and that you have followed the set up instructions described in the mPulse guide.
The mPulse behavior is enabled by default on some properties. If your property does not already include mPulse refer to the instructions in the Property Manager guide for more information.
Once the mPulse-enabled property is active on the Akamai production network, your data (beacons) are directed to your mPulse app. See How mPulse works to learn more.
-
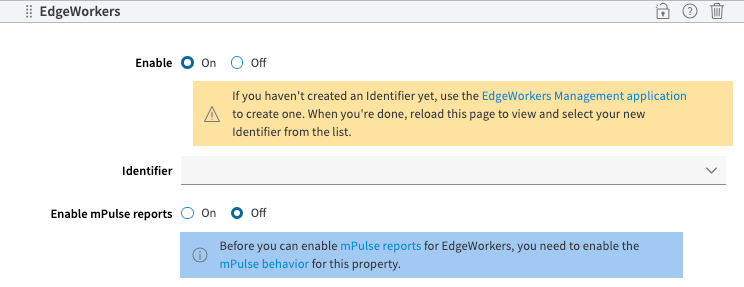
Next, use the toggle button in the EdgeWorkers behavior to set Enable mPulse error reports to On.
-
To stop generating the EdgeWorkers error reports in mPulse you can set the toggle button to Off.
📘 If mPulse is unavailable on your property you will be prompted to enable it before you can turn on the EdgeWorkers reports.
View the EdgeWorkers error reports
EdgeWorkers functions produce an HTTP 500 response if the event handler generates errors due to:
- Unhandled JavaScript exceptions
- Exceeding limits such as CPU and memory
- Timeouts
- JavaScript syntax errors
- Log in to mPulse to enable and view the EdgeWorkers error reports.
- Select EdgeWorkers event handlers as an error source in the App Error List and App Error Summary dashboards.
Refer to the Explore mPulse system dashboards and widgets in the mPulse guide.
The mPulse error reports for EdgeWorkers include the following details.